ScreenshotsGet a sense of what the Excel tool can do and how it presents itself. No surprises. At the core of planning & managing the tasksIn the Tasks tab, you can enter and review in details the information about the project: what tasks, who is working on them, what are the deliverables and the timeline, which tasks are on time / finished / urgent / late?Everyone in the team can update progress on the tasks! When you change the editing mode to prevent any mess-ups, members of the team can only update the information provided in the blue columns. Simple for everyone! Monitoring the tool and getting supportThe Read Me tab contains all the help you may need. It has a step-by-step (easy) setup and gives some insights on how to maintain the tool and do quick checkups on your project from time to time.The Dashboard tab was made to give you the simplest and quickest look at your project. If anything requires more attention from you, it will say so there! 
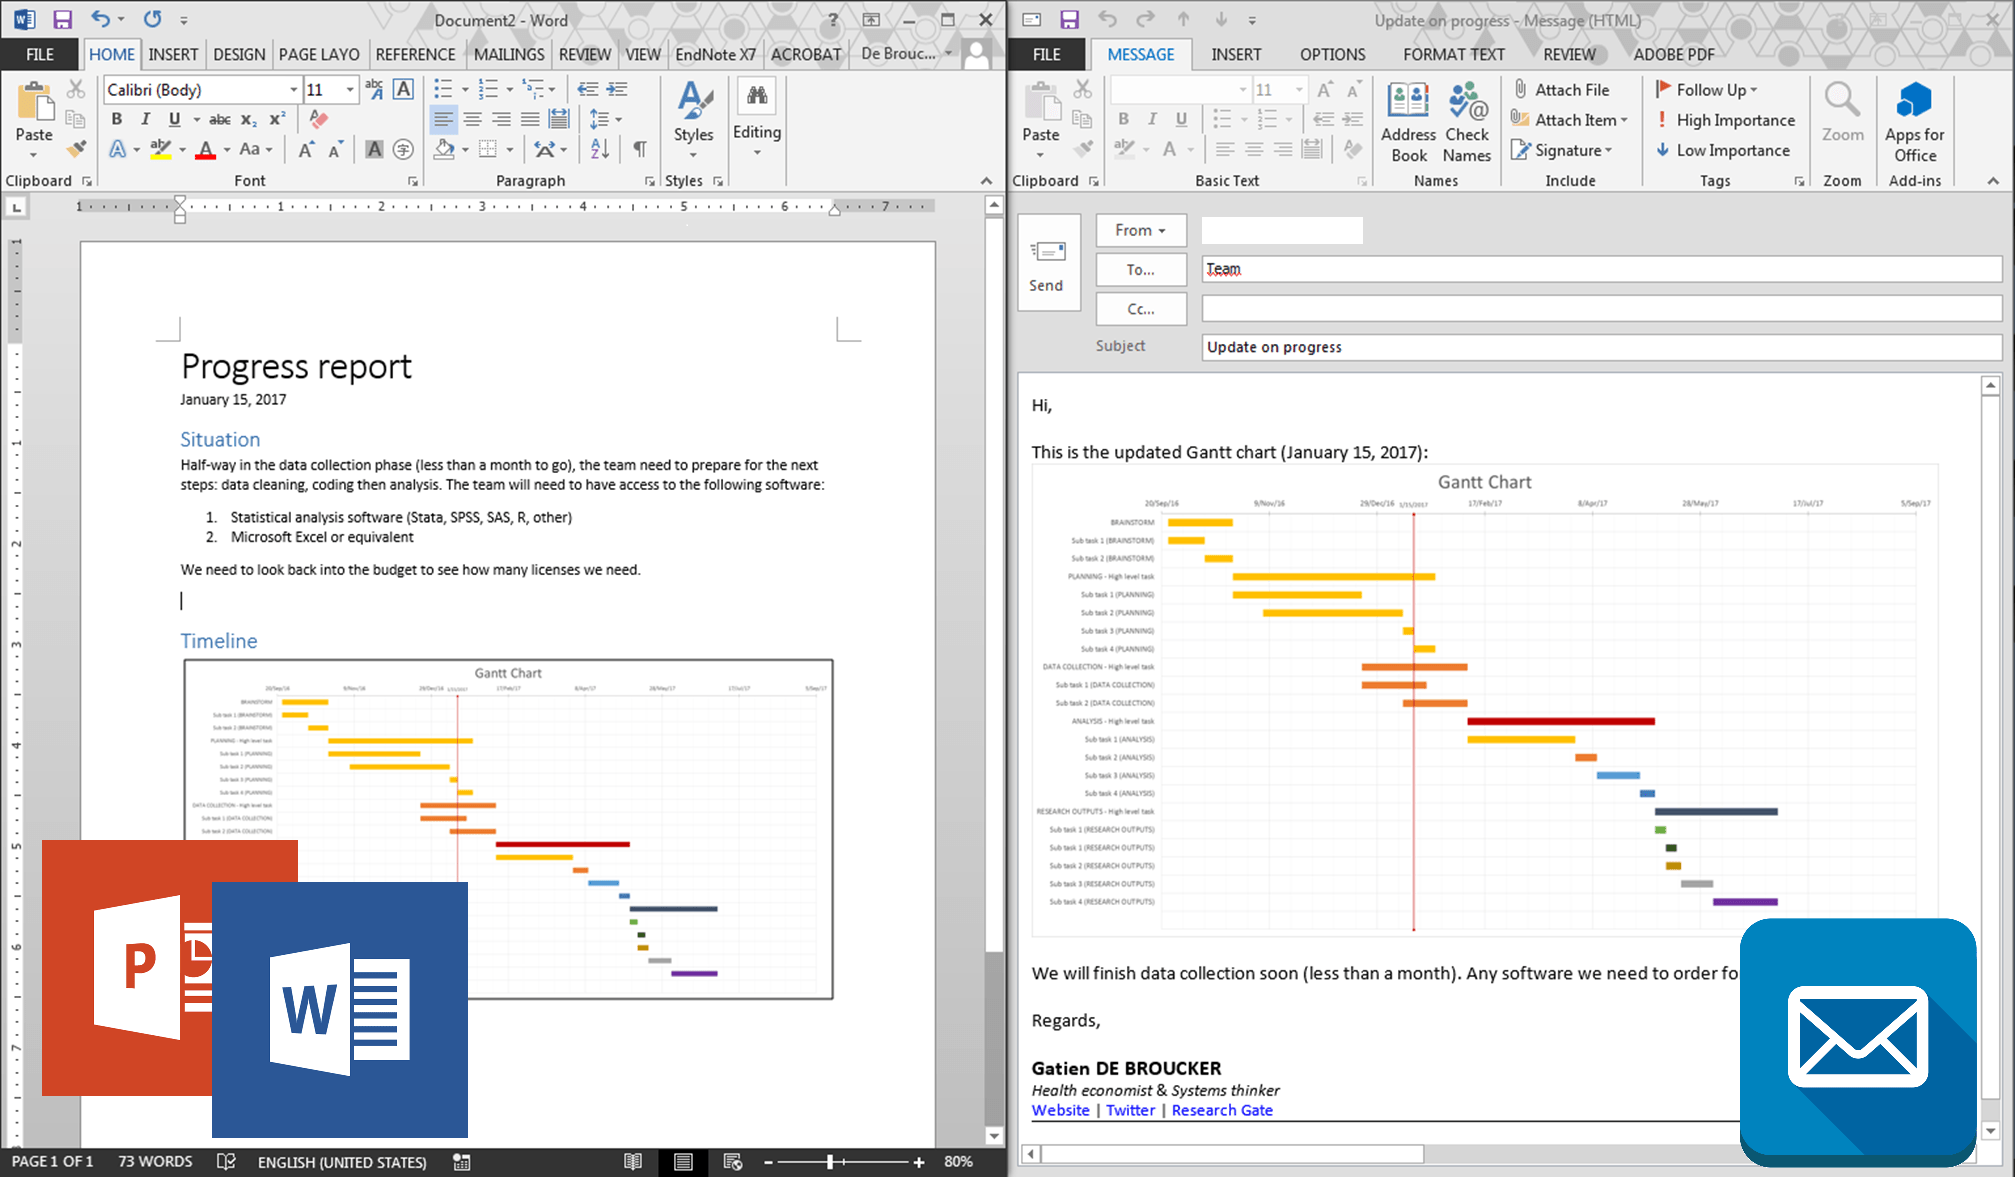
Generating insightful and usable graphsWhen the tasks are set up, their schedule will show in the Gantt chart tab. The chart is updated automatically and can be customized just like any other Excel chart.It is really simple to export the Gantt chart: simply copy-paste it (as an image – suggested) into Word, PowerPoint, Outlook or any other program.