First Time Setup
Setting Modus Operandi for the first time only takes a few steps.
 Step 1 – Add your project’s details
1) Add your team members and collaborators
2) Define the types of tasks
Step 2 – Set up your tasks
3) Enter your first set of tasks
4) Fill in all the necessary details
5) Define the schedule
Step 3 – Review and export
6) Review the Dashboard tab
7) Adjust the dates (Y axis) in the Gantt chart
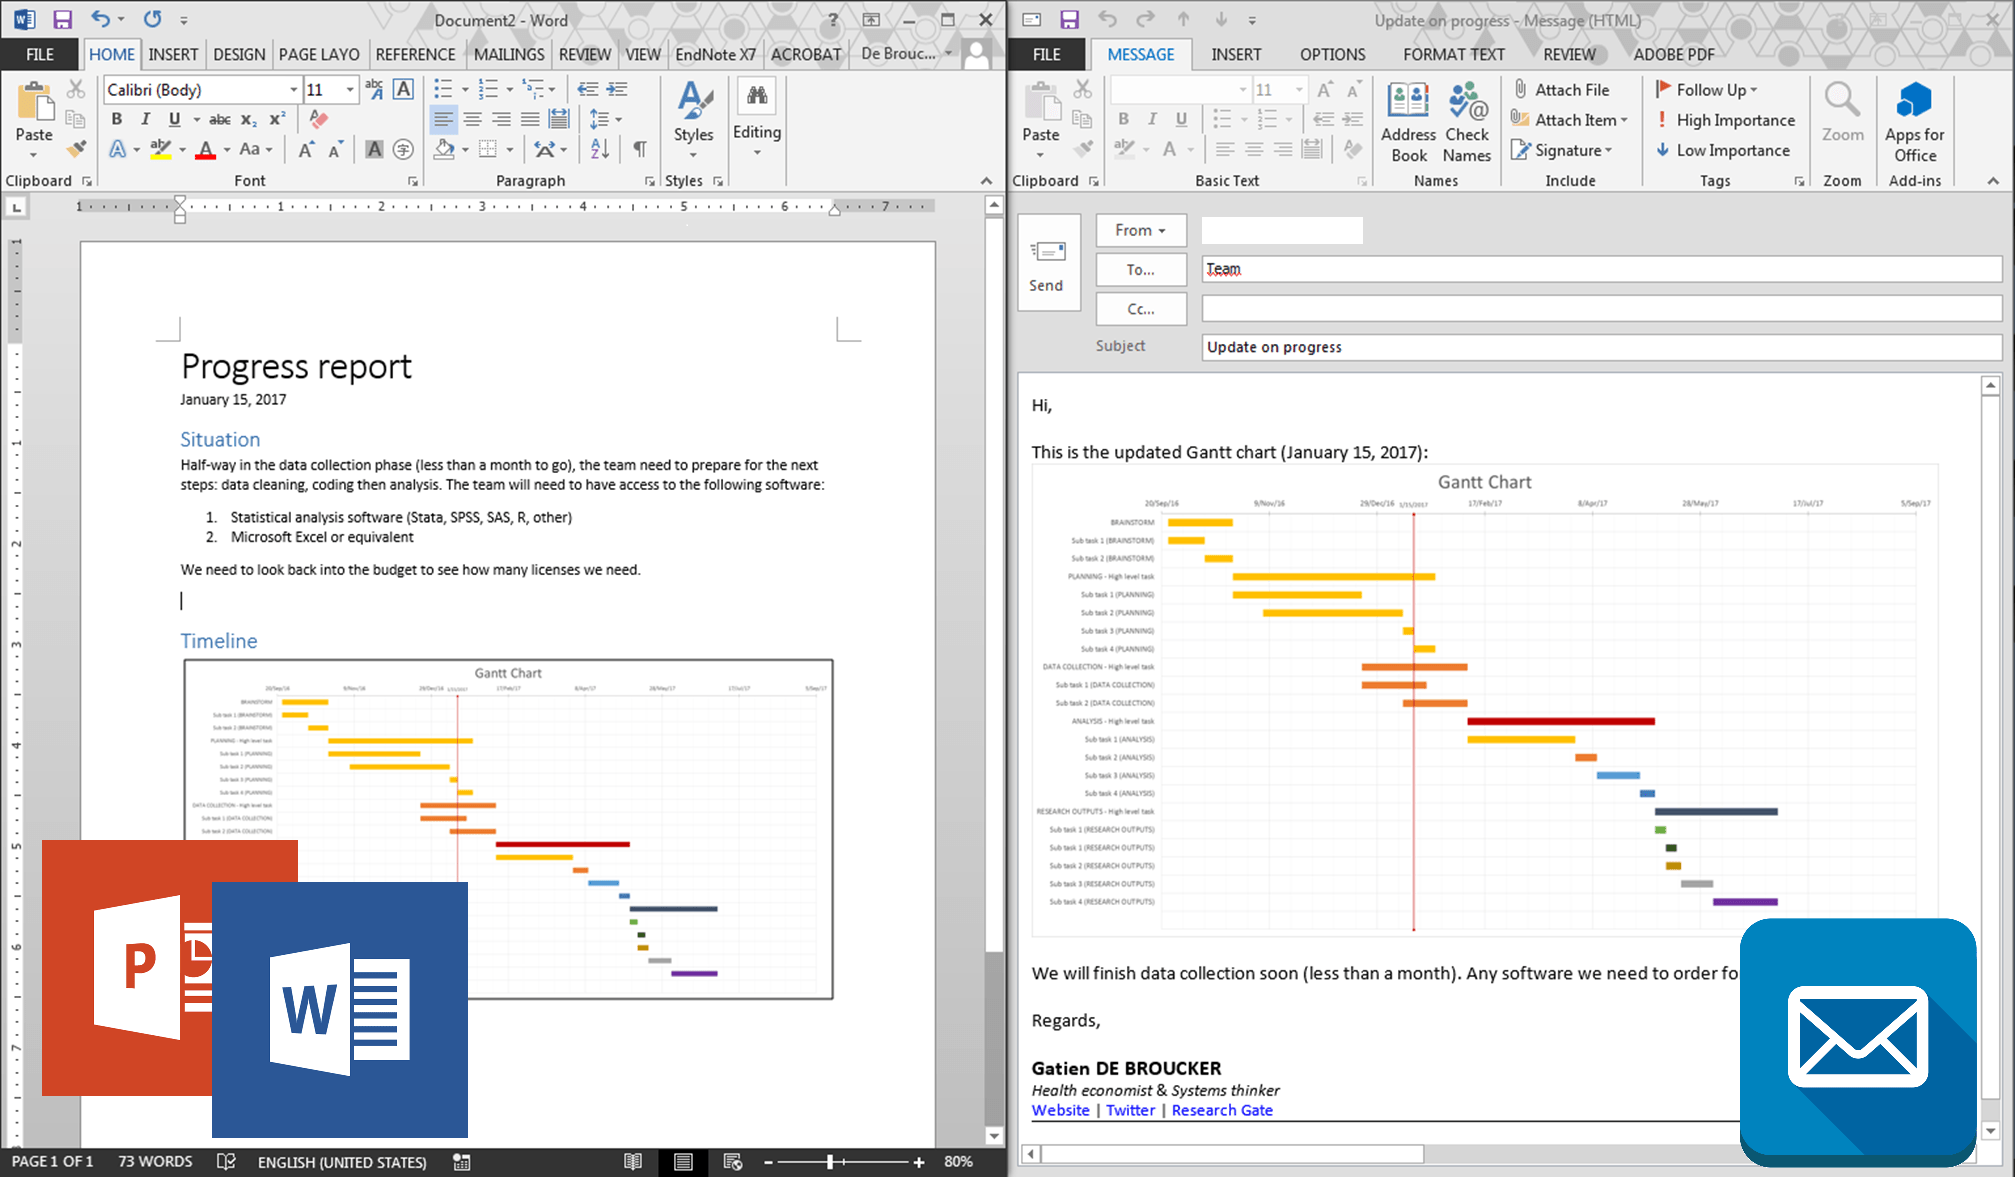
8) Copy-paste the Gantt chart to an email
Step 1 – Add your project’s details
1) In the Team tab, add everyone who will collaborate on the project.
Some names may have already be entered as examples, so simply replace them with your own.
If you want to add more names (and more rows), select any of the names already entered and click on Add new row. The row you currently selected will be duplicated and you just need to replace the duplicate name with the one you wanted to add.
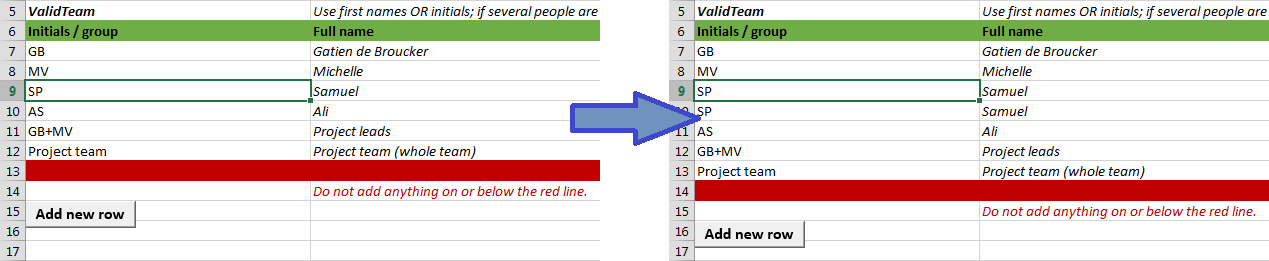
These names will appear in the drop-down menus in the first three columns of the RASCI in the Tasks tab:

People who will frequently work together on tasks can be added as groups.
E.g., GB+MV for Gatien and Michelle / Project leaders
2) In the Types of tasks tab, define the main phases of your project.
Setting up different types of tasks allows you to use different colors in the Gantt chart.
You can also choose to attribute the colours of the Gantt chart to locations (where tasks take place), team of people, or any other characteristics you’d prefer.

Do not change the Roman numerals (left column, ValidType). You do not have to make use of all eleven types proposed. Do not add any additional types of tasks.
These details are not set in stone. You can come back and review / add to them anytime while the project is ongoing.
Step 2 – Set up your tasks
Go to the Tasks tab to do this step.
3) In the Task name column, enter each task needed for the project, one per row.
 At first, do not spend too much time thinking about all the necessary tasks: put down what comes to your mind first. That way, you will allow your mind to think of the project in more details progressively.
Planning is always an iterative and fluid process.
You want to add a new task (row)? You forgot a task in between two already set tasks?
The Add new row button duplicate the row that is currently selected (e.g., if you select the cell B4 and use the button, you will duplicate row 4).
So, simply select the cell with the name of the task that will precede the task you are adding, then click Add new row. Replace the duplicate name with the name of the new task.
You want to delete a task (a whole row)?
Select the whole row that you wish to delete, right-click on it and left-click on Delete.
4) For each task, fill in all the details
ID: For easier reference for you and your colleagues, you can set an identification number for each task.
Type: Attribute the appropriate type based on what you defined in the Types of tasks tab.
%: Set the level of progression (0% for all tasks that were not started yet).

Responsible: Add the person that is accountable for the deliverable / outcome of the task, which includes coordinating all other people or group working on this task. Only one person should be responsible for each task (no group).
Accountable: Add the person / the people / the group that is / are also accountable for the deliverable / outcome of the task as he/she/they do the final sign-off.
Supportive: Add the person / the people / the group that provides resources, support, data or effort to the task: they share the workload of the person responsible. They should be available to work on the task during the whole duration of it.
Consulted: Add the person / the people / the group that is / are usually composed of stakeholders (external to the project team) who need to be engaged in the task to provide input or feedback on any parts of it (e.g., data validation).
Informed: Add the person / the people / the group that is / are usually composed of stakeholders (external to the project team) who are not participating in the task, but who benefit from being informed on the task’s completion and of its deliverables.
Location: Add the location where the task is expected to take place. It’s a good place to set whether the task is done in a specific place or if it can be done remotely. The deliverables may change slightly when the work is done remotely (e.g., additional summary email)
Deliverable: List the deliverables that are expected out of this task. Email confirmations are a good deliverable for less tangible task. Each task should have at least one deliverable.
Done?: Simply put 0 (zero) if the deliverable wasn’t produced yet.
Comments: You may add comments on the task if needed. I prefer to leave this column to provide details if a task’s schedule changes or is late.
5) Fill in the schedule, with consideration to task dependency
Check here for more instructions on task dependency.
Planned Start: Set the start date you plan for this task.
Planned Duration: Enter the duration of the task in terms of days.
You do not need to change the remaining columns for now
Planned End: This is set automatically. Do not change it.
Actual Start: This is set automatically. You can change it as you update your progress.
Actual End: This is set automatically. You can change it as you update your progress.
Status: This is set automatically. Do not change it.
The black columns completely on the right should not be changed.
Step 3 – Review your project and export the Gantt chart
6) In the Dashboard tab, verify if any unexpected alert appear
The “Undefined (U)” alerts and the “Unknown” schedule indicate how many tasks do not have a planned schedule yet.

Keep the alerts in check: it’s not necessary to resolve them (for instance if you cannot assign a schedule yet to certain tasks), but keep in mind that your team will see these alerts and use them to give you feedback.
7) In the Gantt chart tab, adjust the dates of the chart
 Left-click on the Gantt chart and right-click on the Y-axis (dates). Select “Format Axis…”.
In the “Format Axis” window, you have the option to set the minimum and maximum bounds for your chart. Instead of conventional dates it shows the dates formatted in Excel: instead of September 20th, 2016, you obtain 42633. You have to enter the start and end dates you wish to show on your Gantt chart in this Excel format.
To convert a conventional date into an Excel date: (in any cell) use the formula =DATEVALUE(“MM/DD/YYYY”). You can also find this in the Read Me tab.
More info on this formula here
A good thing to note is that the unit of Excel-format dates is in number of days. If you add +1 to 42633, for instance, you’re changing the date from September 20 to September 21.
You can set the time scale by changing the units.
8) Copy the Gantt chart to an email or a document
When you paste the Gantt chart, select the option “Paste as image”. It preserves the formatting you created and customized in Modus Operandi.